Mobile Gaming Statistics 2026: Market Size, Players & Revenue
Mobile gaming statistics for 2026: market growth since 2016, forecasts to 2031, player demographics, and spending by model, all sourced.


Mobile Gaming Statistics 2026: Market Size, Players & Revenue
For this report, the Vetra Mobile team analyzed 14 market research reports and datasets from Sensor Tower, Newzoo, Statista, the Entertainment Software Association, and a January 2026 survey of US mobile gamers, drawn from 19 published sources. The data covers January 2016 through June 2026, plus published forecasts through 2031. The goal was to understand the revenue, player, and spending trends shaping the mobile gaming market. Each firm measures the market differently. Sensor Tower tracks gross app store purchases. Newzoo measures consumer spending across all channels without ads. Statista models consumer spending on mobile game purchases. We report every figure next to its source instead of blending them. Figures marked with an asterisk (*) are Vetra Mobile calculations based on data from the cited source.
Mobile Gaming Market Size and Growth, 2016-2025
Mobile Game App Store Revenue Worldwide, 2016-2025
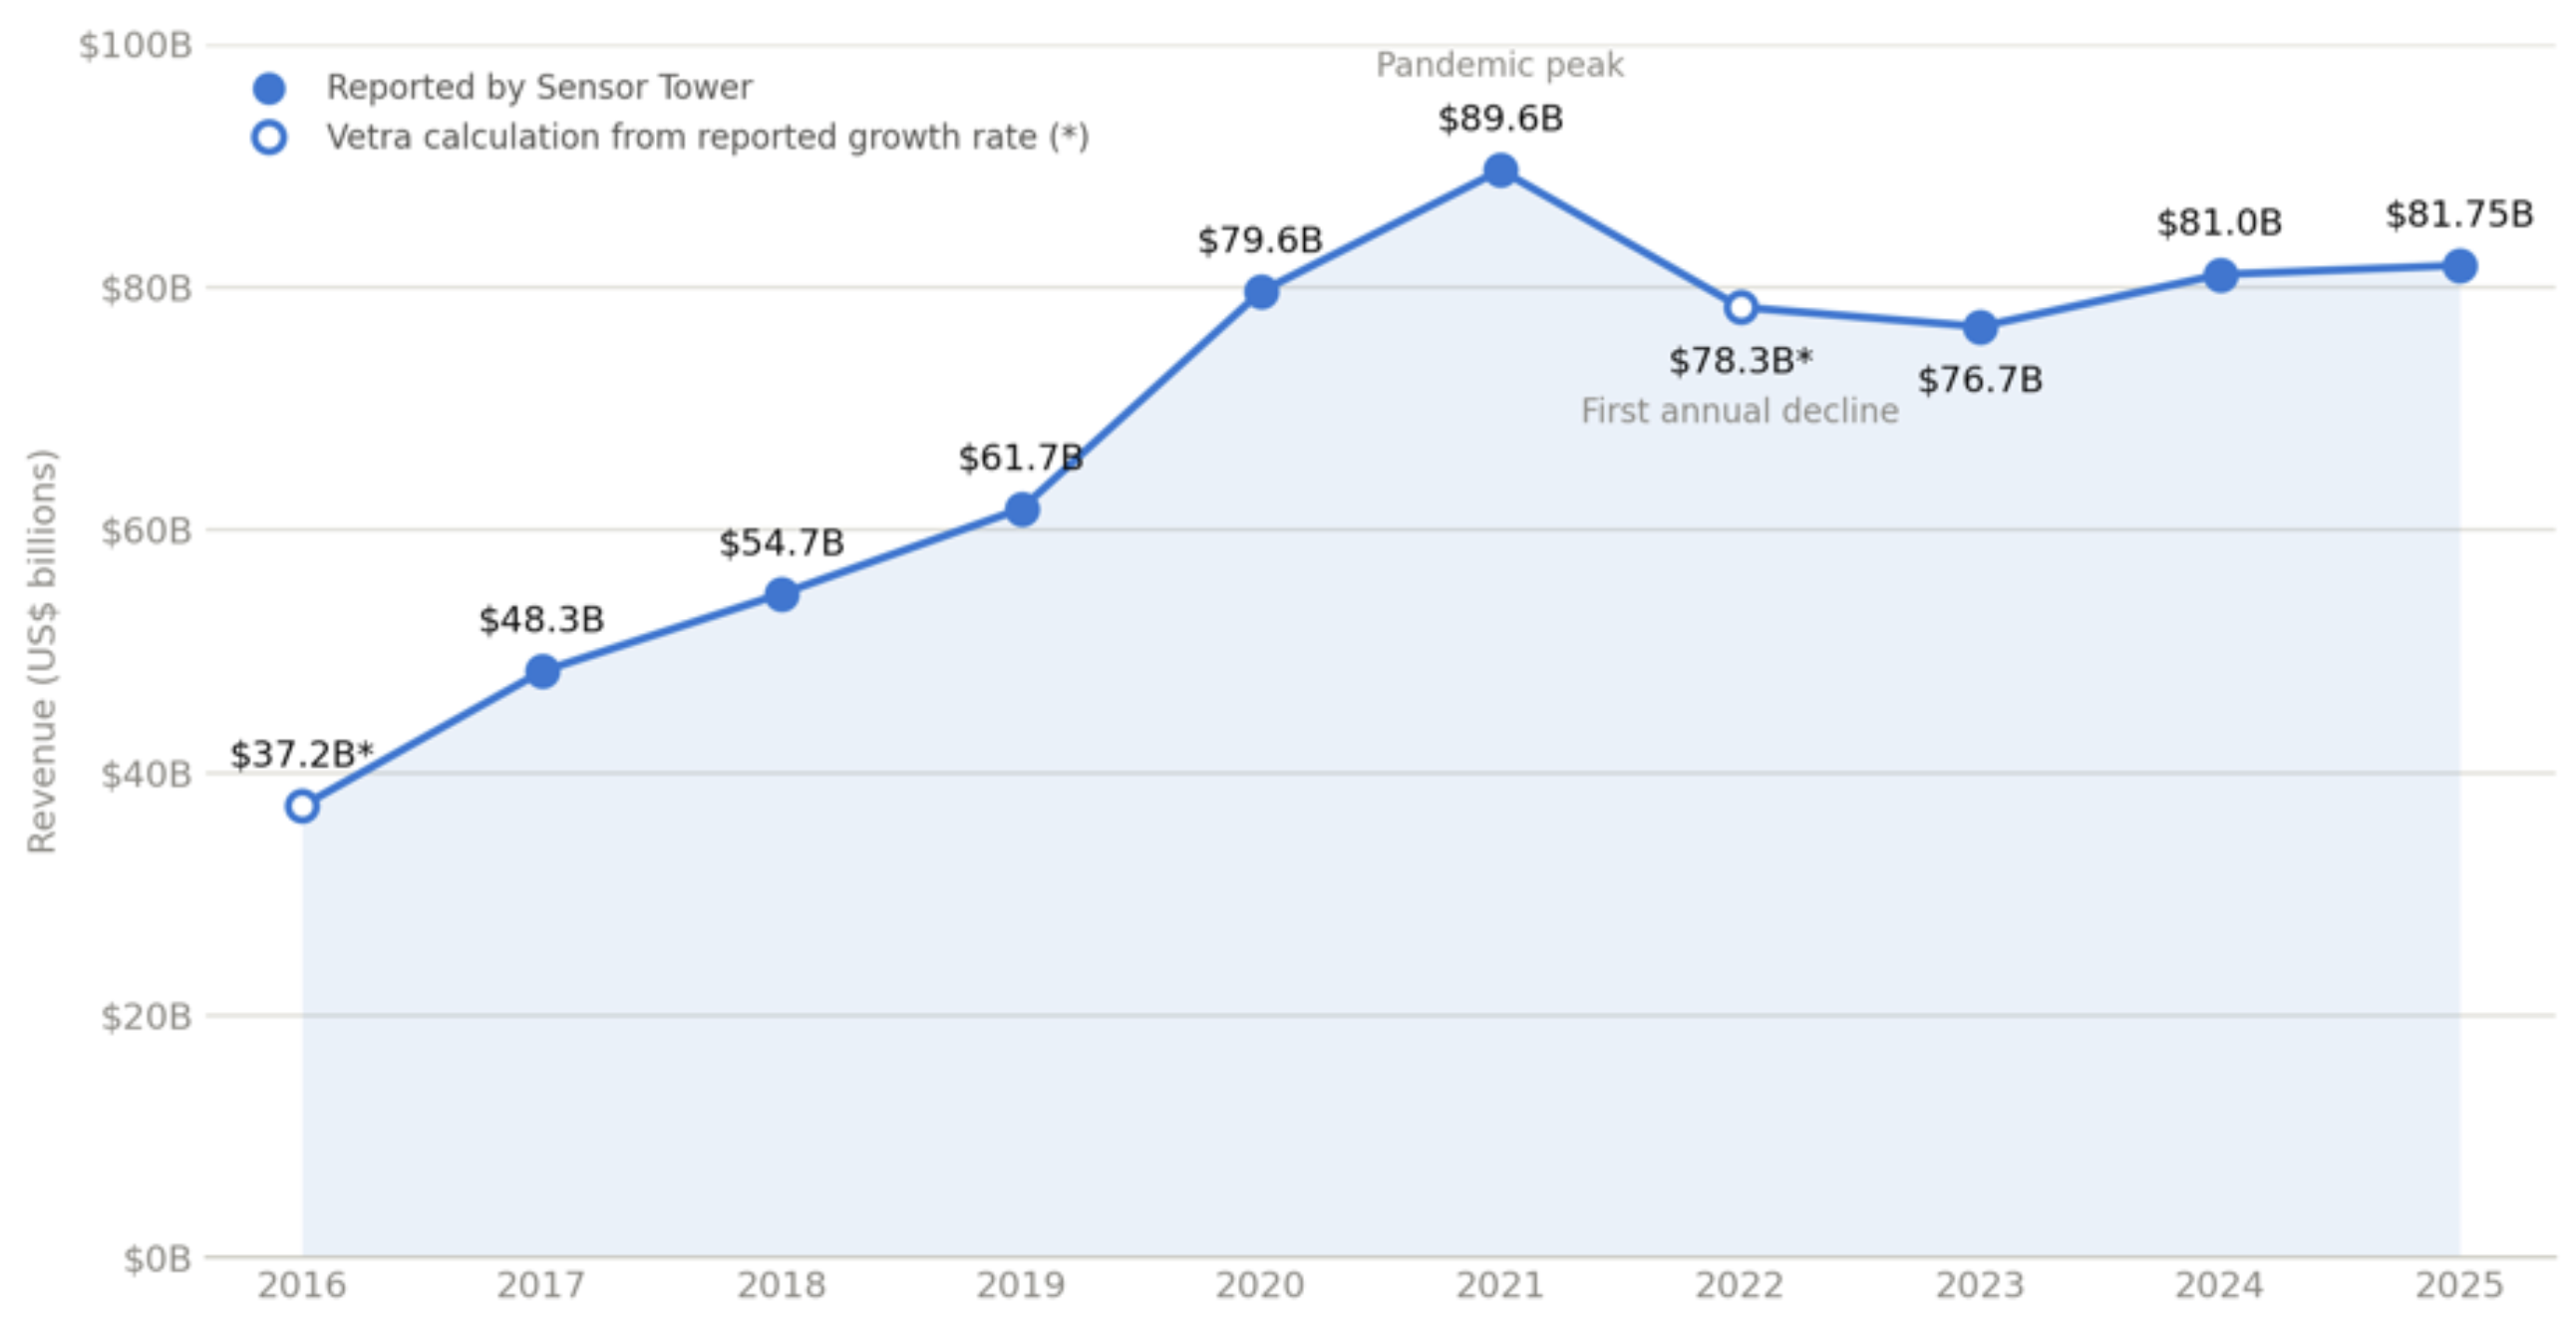
Source: Sensor Tower annual app revenue reports, 2017-2026 editions123456. Hollow markers show Vetra calculations.
The table below presents ten years of worldwide mobile game revenue from the Apple App Store and Google Play, using one tracker's methodology throughout.
Table 1: Mobile Game App Store Revenue Worldwide, 2016-2025
Scope: Gross App Store and Google Play spending (China iOS only). The 2021 figure is Sensor Tower’s December 2021 estimate.
Key takeaways:
- The data shows mobile game app store revenue more than doubled in a decade. It grew from $37.2B1* in 2016 to $81.75B6 in 2025, about 9.1%* compound annual growth.
- Revenue peaked at $89.6B3 in 2021, then fell 12.6%4* in 2022 as pandemic-era spending cooled.
- 2025 revenue is still about 9%* below the 2021 peak. Growth has stayed in the low single digits since 20234 5 6.
- The slowdown continued into 2026. Store revenue reached $40B7 in the first half, down 2.0%7 from a year earlier.
Mobile Gaming Revenue Forecast, 2026-2031
After ten years of history, the next question is where the market goes from here. The table below shows Statista's forecast. Statista measures a wider scope than Sensor Tower, so its figures should not be read as a continuation of Table 1.
Table 2: Mobile Games Revenue Forecast Worldwide, 2026-2031
Statista publishes the 2026 and 2031 values and a 5.48% CAGR. The 2027-2030 values and all yearly growth rates after 2026 apply that CAGR evenly.
Key takeaways:
- Statista projects mobile games revenue will reach $152.61B8 by 2031, growing 5.48%8 a year.
- Newzoo's 2026 estimate is $121.1B9, up 6.8%9. That puts two major forecasters about $4B* apart for 2026.
- Both forecasts expect mid-single-digit growth, well below the double-digit years of 2016 to 20211 2 3.
Mobile vs. Console vs. PC, 2026
Readers often want to know how mobile compares with other gaming platforms. The table below shows each platform's revenue and player base for 2026.
Table 3: Global Games Market by Platform, 2026
The global market totals $213.9B9, up 6.1%9, across 3.70B9 unique players. Player shares add up to more than 100% because many people play on more than one platform, and Newzoo counts each person on every platform they use.
Key takeaways:
- The data shows mobile earns more than console and PC combined, with 56.6%10 of global games revenue.
- Mobile is also the fastest-growing platform in 2026, at 6.8%9.
- 84%9 of all players game on mobile, so the phone is the one screen nearly every player shares.
- The three platform player counts add up to about 4.73B*, compared with 3.70B9 unique players. The gap of roughly 1B* reflects people who play on more than one platform.
How Many People Play Mobile Games, by Age
Newzoo counts 3.10B9 mobile players worldwide in 2026. The table below shows how US adult mobile gamers compare with the overall US adult population by age.
Table 4: US Adult Mobile Gamers by Age
Based on a January 2026 survey of 2,500 US adults who played a mobile game in the prior three months.
Key takeaways:
- Our analysis reveals adults aged 35 to 44 are the most overrepresented mobile gaming group, at nearly twice their share of the population (index 19112*).
- Adults 25 and older make up 86%12* of US adult mobile gamers.
- The 18 to 24 group is underrepresented (index 7012*), which runs against the image of mobile gaming as a young player's hobby.
- Across all platforms, the average US player is 37 years old13.
Revenue and Players by Region, 2026
Once readers know who plays, the next question is where they are and how much each region spends. The table below compares revenue and players across all platforms by region.
Table 5: Games Revenue and Players by Region, 2026
The Latin America player count is calculated from Newzoo's 3.70B global total minus the other four regions.
Key takeaways:
- Asia-Pacific generates nearly half of global games revenue (47%11) and is home to more than half of all players.
- Our analysis reveals North America earns $226.711* per player. That is more than four times Asia-Pacific and about 17 times the Middle East & Africa.
- The Middle East & Africa is the fastest-growing region for revenue, up 10.3%11, followed by Latin America at 7.9%11.
Player Growth, 2026 and Forecast to 2029
Regional totals show where players are today. The table below shows where the player base is growing, and how fast it is expected to grow through 2029.
Table 6: Player Growth by Segment, 2026 to 2029
Key takeaways:
- The data shows the Middle East & Africa adding players at nearly twice the global rate (7.9%9 vs. 4.4%9).
- Newzoo expects 80%14 of the 117.8M14 net new mobile players in 2026 to come from Central Southern Asia, Southeast Asia, and the Middle East & Africa.
- The global player base passes 4 billion by 20299, but growth slows every year of the forecast.
- As audience growth flattens, Newzoo expects growth to depend more on keeping and monetizing existing players9.
What Mobile Gamers Spend: Monetization Models and ARPU
Mobile games earn money in two main ways: players buy items inside the game, or the game shows ads. The table below compares the two.
Table 7: Mobile Game Revenue by Model
US revenue shares cover January to May 2026.
Key takeaways:
- In-app purchases generate nearly four of every five dollars in US mobile game revenue (77.9%15*).
- The data shows ads spreading fast: 55.6%15 of mobile games now use ad monetization.
- 96% of 2025 mobile game downloads were free-to-play, which makes paid downloads a small part of the market.
- Ads are the majority revenue source in only three large markets: India (70.3%15), Indonesia (55.8%7), and Brazil (54.7%7).
Per-Player Spend
Total revenue shows the size of the market. The table below shows what that means per player, and how many players spend at all.
Table 8: Mobile and Global Per-Player Spending
ARPU is average revenue per user. ARPPU is average revenue per paying user. In a separate 2023 consumer study, Newzoo found mobile had the lowest spender conversion of the three platforms: 45%18, compared with 55%18 for PC and 66%18 for console.
Key takeaways:
- The average mobile game user generates $70.218 a year.
- Fewer than half of all players spend money on games (44.6%11).
- Our analysis reveals mobile turns players into spenders at a lower rate than PC or console14 16, so its revenue depends on a smaller group of payers.
Largest Mobile Game Markets by Store Revenue, H1 2026
Spending is concentrated in a handful of countries. The table below shows the four largest mobile game markets by app store revenue.
Table 9: Top Mobile Game Markets by In-App Purchase Revenue, H1 2026
Key takeaways:
- US players account for about 30%7* of all mobile game app store spending worldwide.
- The four largest markets generate nearly two-thirds (64.7%7*) of global mobile in-app purchase revenue.
Mobile Game Store Revenue Growth by Market, H1 2026
Size and growth tell different stories. The table below shows which markets are growing and which are shrinking.
Table 10: Mobile Game IAP Growth by Market, H1 2026
Key takeaways:
- The data shows Europe was the only region where mobile in-app purchase revenue grew in the first half of 20267.
- The US, Japan, and South Korea all declined8.
Top Genres by Revenue, Downloads, and Playtime, H1 2026
The genres that earn the most are not always the ones people download or play the most. The table below ranks the top three genres on each measure.
Table 11: Top Mobile Game Genres by Three Measures, H1 2026
Key takeaways:
- The data shows no genre leads on all three measures. Strategy earns the most, Puzzle is downloaded the most, and Simulation is played the most.
- Strategy tops revenue with about 1B7 downloads, roughly a fifth of Puzzle's volume.
- Puzzle in-app revenue grew almost 20%7, while Strategy fell about 5%7.
Ad Revenue by Game Segment, Feb-Apr 2026
Table 7 showed ads are a growing revenue source. The table below shows which types of games earn that ad money.
Table 12: Mobile Game Ad Revenue by Segment, February to April 2026
Hypercasual games are simple, instantly playable titles. Mid-core games are deeper titles, such as strategy and role-playing games.
Key takeaways:
- Casual and hypercasual games generate 80%15 of mobile game ad revenue.
- Mid-core games earn only 4%15 of ad revenue, because they make most of their money through in-app purchases.
- Puzzle games alone account for 53%15 of ad revenue, or $2.65B7.
Mobile Gaming Statistics 2026: What the Numbers Mean for Mobile Players
The data shows mobile gaming is a mature, $80B-plus6 app store market that more than doubled in a decade1 6. Mobile is now the world's main gaming screen, with 3.10B9players and 56.6%10 of global games revenue. Most of those players are adults, and US adults aged 35 to 44 play at nearly twice their share of the population12*. Growth is slowing, and the market's next gains depend on how much existing players engage and spend9.
With 84%10 of players gaming on mobile, the phone plan is part of the gaming setup. Vetra Mobile is a prepaid wireless carrier built for creator fans. Its Unlimited Elite plan costs $65 a month with AutoPay19. It also includes a 30 GB mobile hotspot and a monthly VSUB redeemable on Twitch or YouTube Premium. Its Broadband Facts label lists typical latency of 17 to 32 ms17. Plan details and the full Broadband Facts labels are on the Vetra plans page.
References
1. Sensor Tower. "Global App Revenue Grew 35% in 2017 to Nearly $60 Billion." January 2018. https://sensortower.com/blog/app-revenue-and-downloads-2017
2. Sensor Tower. "Consumer Spending in Mobile Apps Grew 17% in 2019 to Exceed $83 Billion Globally." January 2020. https://sensortower.com/blog/app-revenue-and-downloads-2019
3. Sensor Tower. "Global Consumer Spending in Mobile Apps Reached $133 Billion in 2021, Up Nearly 20% from 2020." December 2021. https://sensortower.com/blog/app-revenue-and-downloads-2021
4. Sensor Tower. "Global Mobile Games Market Outlook 2024." July 2024. https://sensortower.com/blog/state-of-mobile-games-market-outlook-2024-report
5. Sensor Tower. "2025 State of Mobile: Consumers’ $150 Billion Spent on Mobile." 2025. https://sensortower.com/blog/2025-state-of-mobile-consumers-usd150-billion-spent-on-mobile-highlights
6. Game World Observer. "In 2025, the revenue of the mobile gaming market grew, but only slightly" (Sensor Tower State of Mobile 2026). January 21, 2026.https://gameworldobserver.com/2026/01/21/in-2025-the-revenue-of-the-mobile-gaming-market-grew-but-only-slightly-analysis
7. Sensor Tower. "H1 2026 Digital Gaming Market Index: Mature Markets, Tougher Ads, and a World Cup Lift." July 2026. https://sensortower.com/blog/h1-2026-digital-gaming-market-index
8. GameDev Reports. "Sensor Tower: The Gaming Market in H1’26." August 17, 2026. (Detailed figures from the Sensor Tower H1 2026 Gaming Digital Market Index.)https://gamedevreports.substack.com/p/sensor-tower-the-gaming-market-in
9. Statista Market Insights. "Mobile Games - Worldwide." Accessed September 2026. https://www.statista.com/outlook/amo/media/games/mobile-games/worldwide/
10. GamesBeat. "Global players could reach 4 billion by 2029 | Newzoo." August 25, 2026. Primary: Newzoo Global Games Market Report 2026, https://newzoo.com/reports/newzoo-s-global-games-market-report-2026 https://gamesbeat.com/global-players-could-reach-4-billion-by-2029-newzoo/
11. Storyboard18. "$213.9 Billion gaming market: Growth shifts from finding players to monetising them." 2026. https://www.storyboard18.com/gaming-news/global-games-market-to-hit-2139b-by-2026-growth-slows-ws-l-110433.htm
12. MediaNews4U. "Global games market to reach $213.9 billion as player base hits 3.7 billion: Newzoo Report." September 11, 2026. https://www.medianews4u.com/global-games-market-to-reach-213-9-billion-as-player-base-hits-3-7-billion-newzoo-report/
13. MarketingCharts. "How Does the Demographic Makeup of Mobile Gamers Compare to the General Population?" April 9, 2026. https://www.marketingcharts.com/demographics-and-audiences-238228
14. Entertainment Software Association. "Two-Thirds of Americans Play Video Games Every Week According to New Report from the Entertainment Software Association." June 3, 2026. https://www.theesa.com/two-thirds-of-americans-play-video-games-every-week-according-tonew-report-from-the-entertainment-software-association/
15. PocketGamer.biz. "No ‘single model’ for growth, says Newzoo." September 22, 2026. https://www.pocketgamer.biz/no-single-model-for-growth-says-newzoo/
16. Game World Observer. "In 2025, mobile game advertising revenue exceeded $12 billion" (Sensor Tower Gaming Deep Dive: Ad Monetization, https://sensortower.com/blog/gaming-deep-dive-ad-monetization-report). July 6, 2026. https://gameworldobserver.com/2026/07/06/in-2025-mobile-game-advertising-revenue-exceeded-12-billion-analytics
17. PocketGamer.biz. "Over 95,000 mobile games were downloaded every minute in 2025" (Sensor Tower State of Gaming 2026, https://sensortower.com/blog/state-of-gaming-2026). February 27, 2026. https://www.pocketgamer.biz/over-95000-mobile-games-were-downloaded-every-minute-in-2025/
18. GameDev Reports. "Newzoo: How consumers engage with video games in 2023." 2023. https://gamedevreports.substack.com/p/newzoo-how-consumers-engage-with
19. Vetra Mobile. "Plans" and Broadband Facts labels. Accessed September 28, 2026. https://vetramobile.com/plans